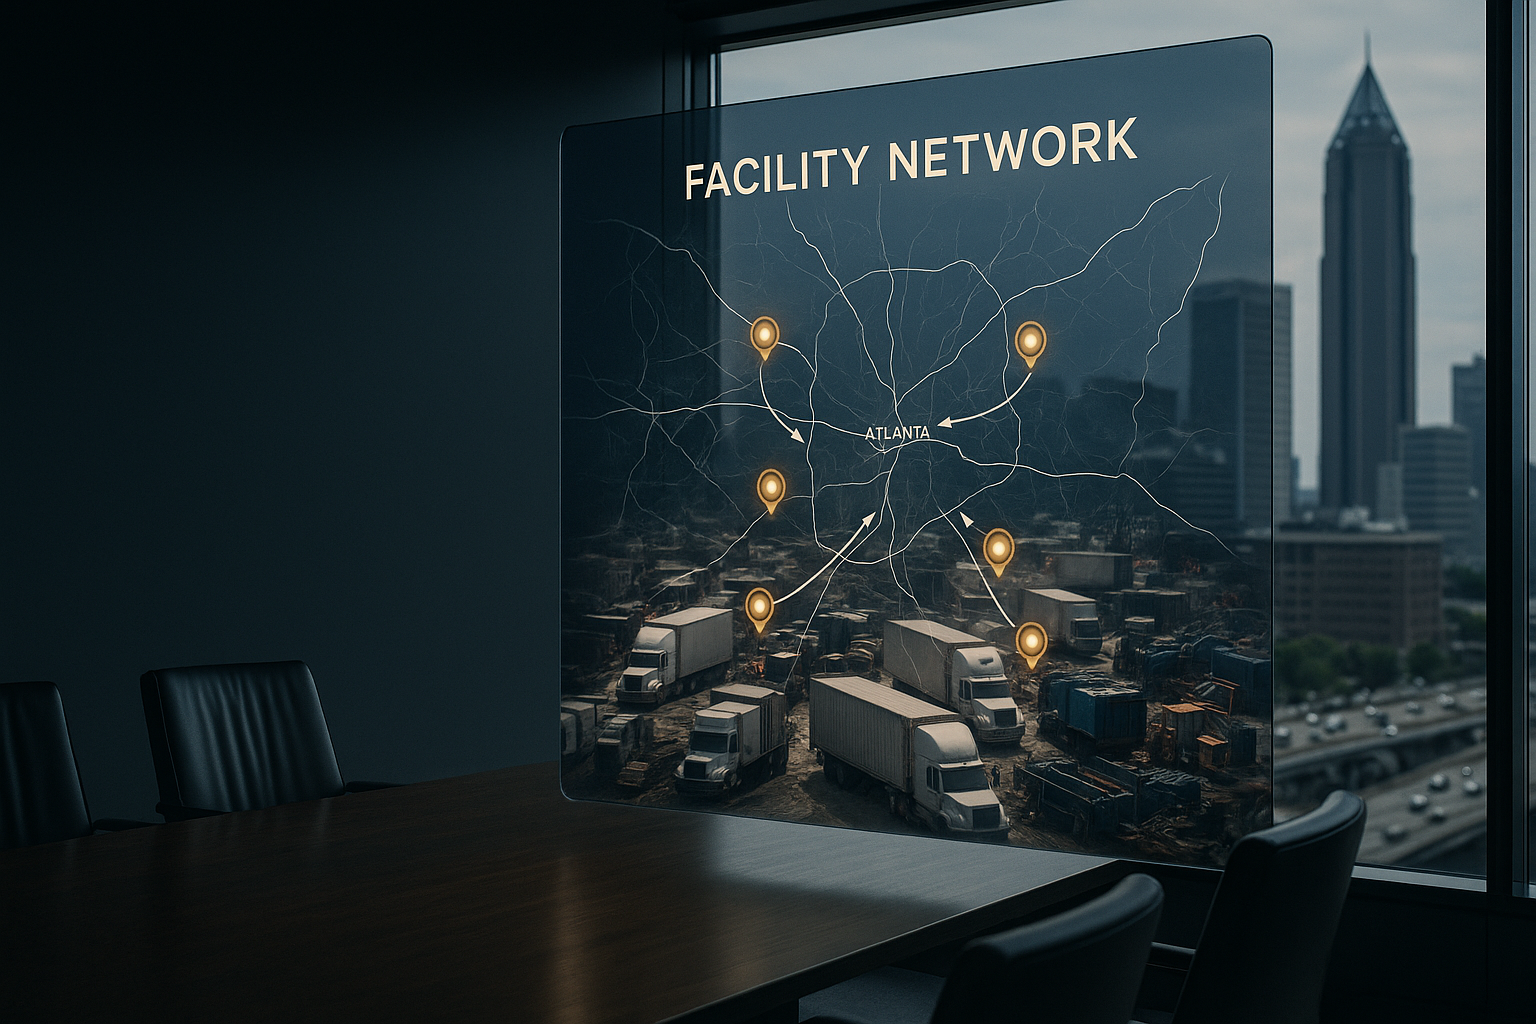
Read the Deck Like an Operator: Atlanta Pharma Networks and 3PL Selection
Executive decks about Atlanta pharma facility networks should signal operating control, not compliance pride. Read them like a 3PL buyer: what capacity is real, what risks are owned, and what decision rights and enforcement exist when lanes wobble. The right narrative connects QA/QC release timing, temperature-control physics, and metro routing realities to service levels and margin protection. The wrong one lists sites, certifications, and partners but never assigns consequences. This piece shows what to look for in how Atlanta pharma CEOs present the footprint, the mechanisms that actually move risk and cost, and the traps to avoid when selecting a 3PL in 2026.
Benchmarks and ranges are directional, based on industry patterns. Actual results vary by operation size, market conditions, volume, and provider capabilities. Validate all metrics with your specific providers and operational context.
ATL benchmark box: operator numbers that change behavior (2026)
- Release-to-tender SLA: 120–180 minutes by SKU class; on-time dispatch (by cutoff) targets 96–98% for domestic hospital deliveries; service credits typically trigger below 95%.
- Onboarding timeline: core WMS/TMS + DSCSA flows 6–12 weeks; full validation and parallel run 8–14 weeks; STA/TSA badging adds 1–3 weeks for airside-adjacent providers.
- Cost structure: - Pick/pack $1.00–$2.25 per order line; cold-pack adders $3.50–$7.00 per carton; gel/phase-change packs $4–$12 per set; dry ice $1.20–$2.00/lb. - Storage ambient $1.25–$2.50 per pallet/day; 2–8°C $2.50–$6.00; frozen/cryogenic $6.00–$12.00. - Courier (ATL metro): ambient $45–$85/stop; 2–8°C $80–$150/stop; frozen with dry-ice handling $110–$225/stop. - 3PL management fee: 3–7% of transport spend or $0.50–$1.50 per order; implementation $25k–$75k one-time.
- Commercial baselines: service credits 2–8% of monthly management fees for SLA misses; data uptime SLA 99.5–99.9%; EPCIS event failure threshold ≤0.2% with 15–30 min auto-retry.
- Accessorials: detention $75–$120/hour after 30–60 min free time; re-icing $25–$60/carton; after-hours pickup $35–$85; ATL airport handler storage $35–$90 per ULD/day.
- Fuel & surcharges: LTL FSC typically 25–40% of linehaul indexed to DOE; parcel DAS/peaks add $2–$8 per package Q4; residential/appointment adders $3–$15.
- Performance levers: dimensional weight optimization and seasonal pack-out tuning drive 12–28% transport cost reduction; proactive lane re-qualification reduces temperature excursions 20–40% QoQ after a spike.
- ATL operations risk: summer storm ground holds 2–6 hours on 5–10% of late-afternoon flights June–September; release drift of 60–90 minutes drives 8–18% more expedites in mixed ambient/2–8°C portfolios.
Proprietary shorthand you can adopt: the ATL Release Clock = [QA release target time] + [WMS serialization post latency] + [pick/pack takt time by SKU class] + [courier/carrier cutoff minus handoff buffer]. Keep that sum inside your SLA window with 15–30 minutes spare capacity.
Most partner failures start with a board deck, not a warehouse.
Most logistics failures here aren’t carrier problems. They are control problems disguised as glossy facility slides. In Atlanta pharma, the deck that wins investor confidence often omits the operating decisions a 3PL needs to execute without drama.
You’ve probably presented an 18-slide network overview in a Midtown boardroom: pins around McDonough and Fairburn, a cold-chain bullet, a serialization bullet, and a “redundancy” slide with two arrows. The dock-door utilization slide said “TBD” in the corner. Everyone nodded anyway.
Hard truth: a facility network is only as good as the release clock that runs it. If QA owns release but Operations owns on-time delivery, you’ve already split the atom with no containment.
Your cold chain isn’t a facility list. It’s a promise with a physics problem.
Why do Atlanta pharma facility narratives mislead 3PL selection?
Name the causes before prescribing fixes. The problem persists because:
- Compliance-first storytelling crowds out operating thresholds. CEOs emphasize inspections, certifications, and audits. Buyers need dock hours by product class, yard capacity during peak, release-to-ship cadence, and escalation rights when a lot is held.
- Ownership ambiguity at release gates. QA sets standards; Operations carries service risk. Without a stated handoff time and financial consequence, delays look like “process.” They’re not. They’re margin leaks.
- Lane qualification treated as an event, not a living system. Thermal profiles pass in validation, then shift when ATL ramp congestion, afternoon storms, or handler staffing changes. No one owns requalification triggers.
- Systems integration optimism. Serialization and DSCSA data move between systems on paper. In practice, API cadence, master data drift, and exception queues create hold times that the deck never mentions.
- Redundancy without capacity math. “Dual sites” read well. But if the backup in South Fulton lacks couriers pre-qualified for cryogenic moves, it’s not redundancy. It’s a map feature.
- Commercial-neutral presentations. Pricing and penalty structures are hidden during board talk. That’s fine until procurement runs an RFP without the risk allocation spelled out in the story leadership approved.
Tools amplify discipline. They don’t create it. A new visibility platform will document misses faster; it won’t assign who pays when a release slips past 3 p.m.
Where does the money leak when the narrative is wrong?
Exposure grows with four drivers you already track: shipment value and shelf-life sensitivity, order velocity, release-to-pick latency, and excursion risk on qualified lanes. Add how often you expedite to catch up and you see the contour of your loss even before you quantify it.
Consider a hypothetical $80M specialty pharma based in Atlanta with fill-finish near South Fulton and distribution concentrated around McDonough. Daily hospital deliveries include ambient, 2–8°C, and frozen SKUs. QA release targets noon; carriers collect 2–4 p.m.; late-day courier pickups cover urgent cases. When release drifts to 2 p.m., picking competes with outbound staging and serialization exceptions push a subset to next day. Expedites happen on the most sensitive SKUs. Each delay compounds: higher touch, higher accessorials, higher claims exposure if temperature windows are tight.
Regulatory friction raises stakes. DSCSA requires interoperable, package-level traceability across trading partners; serialization mismatches can stop shipments (FDA DSCSA Guidance). Stopped shipments don’t just defer revenue. They pull managers into manual rework, consuming the very people needed to prevent the next stop.
Directional market pressure hasn’t eased either. Logistics costs and inventory carrying pressures remain improve versus pre-crisis baselines (CSCMP State of Logistics, 2025). Atlanta carriers didn’t reduce their invoices out of sympathy.
Quantify the leak: each 60–90 minute release drift typically increases same-day courier expedites by 8–18%, adding $80–$225 per urgent stop; two-week storm clusters can lift re-icing and handler storage by $4,000–$12,000/month; a 0.3% excursion-related claim rate on a $12M shipment cohort is $36,000 exposure per quarter before soft costs.
What mechanisms actually move risk and margin in Atlanta pharma logistics?
Focus on levers that change behavior.
Temperature control without stability data control is wishful thinking.
Mechanism: Stability data defines allowable excursion windows and packaging choice. When QA keeps data private “to avoid confusion,” 3PLs use generic pack-outs or over-ice, increasing weight, accessorials, and condensation risk. Threshold: the first heat wave on the I‑75 corridor. Failure mode: re-icing at the ATL ramp with no SOP acknowledgment, voiding validation and triggering CAPA.
Release timing is the real capacity constraint.
Mechanism: Noon release with a 2–4 p.m. pickup window keeps pick waves stable. A 90-minute slip pushes work into the same labor block as outbound staging, raising touches and miss risk. Incentive distortion: QA optimizes correctness; Operations optimizes OTD. Without a joint KPI (release-to-tender cycle time), slippage becomes normal. Failure mode: chronic “just-in-time” expedites become structural.
Serialization and DSCSA data cadence drive dock-to-stock and ship speed.
Mechanism: If the WMS/TMS integration posts serial data in near real time, exceptions are triaged early. If it batches nightly, late-day releases hit a wall. Threshold: same-day ship commitments. Failure mode: cartons wait in a quarantine zone while customer service promises ETAs based on carrier cutoffs that no longer apply.
Redundancy is capacity plus pre-qualified couriers, not a second pin on a map.
Mechanism: A backup site in metro Atlanta only works if it has audited freezers, dual power, generator runtime documented, and couriers with verified lane performance for cryogenic and 2–8°C. Incentive: leaders like to say “dual-site.” Without budget and SOP parity, the site won’t actually take live volume. Failure mode: when the primary site pauses, the backup takes ambient only. The most at-risk SKUs still stop.
ATL air cargo reality matters more than slideware.
Mechanism: Hartsfield-Jackson supports pharma-capable handlers and processes aligned to CEIV Pharma. But ramp and handler throughput vary by time of day and weather. Threshold: late afternoon summer storms over Atlanta. Failure mode: a brilliant thermal lane on paper becomes a four-hour ground hold with no pre-chilled ULDs reserved.
Commercial terms shape operating behavior.
Mechanism: SLAs with service credits tied to release-to-delivery time change how a 3PL staffs Atlanta pickups. Pure OTD targets with no financial teeth become aspirational. Department tension: Procurement optimizes rate; Operations optimizes service; Finance optimizes predictability. Without an agreed risk ledger, who pays for expedites, who absorbs claims, conflict shows up as “provider underperformance.”
Which trade-offs are you making when you design and present the Atlanta footprint?
| Decision | What it improves | What it reduces | What it requires |
|---|---|---|---|
| Single DC near McDonough | Pricing power, simpler QA oversight | Redundancy, last‑mile speed to far metro edges | Stronger release discipline and courier surge plans |
| Dual nodes (South Fulton + Eastside) | Resilience, closer-to-patient windows | Standardization, inventory efficiency | Mirror SOPs, synchronized stability data and training |
| Premium packaging with wider thermal hold | Excursion tolerance, fewer re-ices | Payload per carton, freight economics | Proof that handlers adhere to pack-out specs |
| Strict SLA with service credits | Accountability, staffing priority | Base rate flexibility | Reliable master data, enforceable exceptions |
| Courier-only last mile for hospitals | Speed, appointment agility | Per-stop cost efficiency | Lane qualification, sealed thermal SOPs |
What are the green flags vs red flags in an Atlanta CEO facility narrative?
| Green flag | Red flag | Logistics implication |
|---|---|---|
| Release-to-pick KPI stated with owner and threshold | “Daily release” with no time window | Predictable dock waves vs scramble and expedites |
| Named ATL handlers with CEIV-aligned SOPs (no brand hype) | “Global partners” with no ATL specifics | Real ramp playbooks vs marketing wallpaper |
| Redundancy defined as capacity + qualified couriers | Two sites, one courier contract | True failover vs ambient-only backup |
| Serialized data cadence published (near real time) | “Integrated” with weekly audit language | Same-day ship viability vs quarantine backlog |
| Escalation path when ATL storms ground flights | “Weather plan” with no decision rights | Controlled delays vs unmanaged holds |
Where does this fail in Atlanta: and how does the failure actually happen?
Failures are predictable when you know the mechanism:
- Afternoon storm exposure: ATL summer storms create ground holds. Without pre-booked cold storage and handler communication SLAs, cartons sit on the ramp beyond validated time. Claims rise; CAPAs multiply; QA tightens release criteria, slowing everything.
- Release drift normalized: QA slides release from noon to 2 p.m. to “be safe.” Operations meets OTD by expediting select orders. Expedites become policy. Finance loses forecast accuracy. Nobody owns the gap.
- Serialization mismatch at the dock: A packaging line update changes a serial schema. The WMS translation lags. The 3PL quarantine zone fills. Customer service keeps promising delivery windows anchored to pre-cutoff assumptions.
- Redundancy theater: The Eastside backup lacks validated freezers for frozen SKUs. A maintenance event at the primary forces reroutes to ambient-only lanes. “Redundancy” becomes partial service with angry hospitals.
- Handler variability unaddressed: A new shift at an ATL handler skips pre-conditioned ULD checks. Excursions spike for two weeks before anyone correlates the shift roster to temperature trends. KPI ownership was never assigned.
- Onboarding drags: New 3PL at College Park requires STA/TSA badging and SOP alignment. Training schedules slip; parallel runs extend beyond the planned window. For six weeks, performance is worse before it gets better. That is normal if you plan for it.
Implementation friction is real. WMS/TMS integration timelines for mid-market operations often run 6–12 weeks for core flows; add data cleanup and SOP reconciliation and the calendar doubles. Your deck should say that plainly. Better to state it than discover it in week two of cutover.
Humor break you’ve earned: if your deck includes a QR code linking to a folder named “Final_v7_REAL_Final,” plan for three more weeks of change control. The file name already told you.
Risk and friction ledger: where each option fails under pressure
| Option | Capacity crunch failure | Quantified impact | Hidden costs surfaced | Mitigation with price tag |
|---|---|---|---|---|
| Single DC (McDonough) | Storm + power event stalls outbound waves | 2–3 missed cutoffs/day; $6k–$15k/week expedites + claims | Generator fuel/testing $1.5k–$3k/qtr; standby courier premiums 10–20% | Dual-feed + 400–600 kW generator, $250k–$450k capex; service credits 2–5% if SLAs missed |
| Dual nodes (South Fulton + East) | Inventory balance errors during surge | Backorders 1–3% of lines; extra transfers $12–$25/pallet move | Extra cycle counts 0.5–1.0 FTE; cross-dock fees $85–$150/load | Replenishment min/max + ASN discipline; WMS config $10k–$30k one-time |
| Premium pack-outs | Handler deviates from pack SOP | Excursions up 0.2–0.5 pp; $8k–$20k/qtr in spoilage | Heavier DIM charges 6–12% parcel uplift | Handler audits $5k–$15k/yr; IoT loggers $8–$18/shipment |
| Strict SLAs with credits | Vendor sandbags capacity to avoid penalties | Base rates 3–7% higher; fewer off-SOP favors | Change-order friction; governance overhead 2–4 hrs/week | Balanced earnbacks (1–3%) + tiered credits (2–8%) tied to objective data |
| Courier-only last mile | Q4 driver scarcity spikes per-stop rates | Per stop +15–30%; fill rates drop on fringe ZIPs | After-hours $35–$85; wait-time $1–$2/min after 10–15 min | Hybrid courier/parcel with same-day windows; pre-book blocks +10–15% retainer |
Transition friction to plan for: data mapping/GLN cleanup (2–6 weeks), IQ/OQ/PQ test windows colliding with business cycles, and STA/TSA delays for new ATL handler access, each with a predictable cost envelope.
What control architecture turns the presentation into execution?
Control is decision rights, risk allocation, and enforcement: nothing else.
Commercial (with 3PLs, couriers, and handlers)
- Volume and priority: Name peak windows by product class. Guaranteed pickup slots at ATL are earned with real volume commitments.
- Risk ledger: Expedite cost sits with the party that missed the release-to-pick window; excursion claims sit with the party that broke validated SOPs; service credits trigger on release-to-delivery misses, not just first-attempt OTD.
- Penalty clarity: Service credits are automatic based on data feeds, not meeting debates. Hidden accessorials (re-icing, storage, after-hours) are defined with thresholds.
Operational (inside the facility network)
- Data ownership: QA owns stability data accuracy; Operations owns master data in WMS; IT owns integration uptime. When exceptions exceed a set threshold, each has a named fix-by window.
- Exception workflow: A single queue with triage rules: serialization mismatch, temperature alert, release slip. Each mapped to an owner and a timer.
- Lane qualification cadence: Requalify on handler change, season change, packaging change, or excursion cluster. Publish these triggers in the SOP.
Strategic (for leadership and the board)
- Exit triggers: Define when to dual-source a lane or add an ATL handler. Example: two CAPAs on the same lane in a quarter triggers reevaluation.
- Investment thresholds: Approve premium packaging when excursion exposure exceeds a set frequency; fund backup capacity only with courier qualification complete.
- Decision rights: COO approves SLA changes; VP Quality approves stability spec changes; CFO signs risk-ledger amendments. No one can change a lever they don’t own.
Keep internal control lines clean. Don’t create penalty schemes between QA and Operations. Create ownership: “QA owns release accuracy. When release variance exceeds the threshold, QA leads root cause within 48 hours.” That’s enough.
Contract & SLA playbook (numbers your board should recognize)
- Term and exit: per-load or 1–3 year MSAs; standard 60–90 day termination without cause; cure periods 30 days for material breach.
- Volume commitments: monthly minimums or floors (e.g., 70–90% of forecast) with variance bands ±15–25%; below-floor true-up at $0.25–$0.75/order or % of management fee.
- Rate protection and escalators: annual CPI caps 3–5%; fuel surcharge indexed to DOE weekly; published accessorial schedule with thresholds.
- Service credits: 2–8% of monthly management fees when performance falls below thresholds for release-to-tender, on-time dispatch, EPCIS success, and temperature excursion rate. Example trigger: dispatch by cutoff <96% for 2 consecutive months → 4% credit month 2, 6% month 3.
- Data SLAs: API/EDI uptime 99.5–99.9%; EPCIS event ACK within 15–30 minutes; exception queue triage ≤30 minutes P1, ≤2 hours P2; audit logs retained 7–10 years for GxP.
- Claims and liability: temperature excursion claim process initiated within 24 hours; investigation complete within 5–10 business days; cargo liability $0.50–$1.25 per $100 of value (negotiate pharma riders); 3PL negligence carve-outs uncapped for willful misconduct.
- Detention and storage: free time 30–60 minutes; detention $75–$120/hour; cold storage overflow $15–$40/pallet/day short-term; airport handler fees pass-through with 10–15% admin cap.
- Serialization KPIs: event failure threshold ≤0.2%; reconciliation backlog aged >24 hours triggers P1; monthly performance review with corrective actions; penalty adders 1–2% credit if failure >0.5% for 2 consecutive months.
- Release-to-delivery SLA examples: ATL metro hospitals 4–8 hours by class; Southeast region next-day by 10:30 a.m. 96–98%; exceptions documented within 60 minutes with mitigation path.
Enforcement design: make credits automatic (data-driven), cap annual exposure at 10–15% of annual management fees, and enable earnbacks (1–3%) for consecutive months above stretch goals to keep incentives symmetric.
How does presentation quality shift use with Atlanta 3PLs?
Clarity is a force multiplier. A clean Atlanta facility narrative, release windows by SKU class, stability data rules, redundancy with pre-qualified couriers, and enforcement language, gets you better 3PL behavior at a lower volatility premium. Vague slides invite sandbagging and change orders.
There’s a parallel from capital markets worth copying. An alternative investment firm we observed needed credibility without hype. The winning move was restraint: plain structure, risk-first language, and a clear view of how capital was protected. Your facility presentation should read the same way. State the physics, the thresholds, and who bleeds when they’re missed.
When you present Atlanta specifics, handler time windows, realistic storm contingencies, and College Park dock constraints, you compress onboarding and reduce the “learning tax.” Providers prioritize shippers who reduce uncertainty. It’s not favoritism. It’s survival math.
One opinion worth repeating: the strongest partner presentations start with the risk model, not the capability list.
Key Takeaways
- Read facility decks as risk models: release timing, stability data, and escalation rights matter more than site counts.
- Assign joint KPIs like release-to-tender cycle time; without them, QA and Operations optimize against each other.
- Define redundancy as capacity plus pre-qualified couriers and ATL ramp playbooks, not just a second dot on a map.
- Publish DSCSA and serialization data cadence; batched updates turn late releases into next-day misses.
- Make service credits automatic on release-to-delivery misses and publish the risk ledger for expedites and claims.
Frequently Asked Questions
What should an Atlanta pharma facility network presentation include for a 3PL buyer?
Show release-to-pick targets by SKU class, ATL handler time windows, validated packaging specs, and redundancy with pre-qualified couriers. Add DSCSA and serialization data cadence, exception ownership, and escalation paths during ATL weather holds. Include dock hours, yard constraints, and surge plans around McDonough and South Fulton nodes. Most of all, publish who pays when a lever misses.
How does Atlanta’s infrastructure affect pharma logistics execution?
ATL’s air cargo capacity and pharma-capable handling create strong options, but time-of-day and weather variability matter. Afternoon storms can cause ground holds; plan pre-conditioned storage and real-time handler communication. Proximity to distribution suburbs like Fairburn and McDonough helps same-day service if release windows are met. The network works when your SOPs fit Atlanta’s rhythms.
What are common mistakes when selecting a 3PL for an Atlanta pharma network?
Choosing on rate without a risk ledger, assuming redundancy without courier qualification, and treating lane validation as a one-time event. Omitting serialization data cadence and release ownership invites quarantine backlogs. Ignoring ATL ramp realities and handler variability creates excursion clusters. All three raise volatility and claims.
How do we measure 3PL performance beyond on-time delivery?
Track release-to-tender cycle time, temperature excursion count per 1,000 shipments, CAPA closeout time, and batch release cycle time. Add lane risk scores and capacity utilization across Atlanta nodes. Include first-attempt success in hospital deliveries and exception response time. Tie at least one KPI to service credits.
What KPIs belong in the CEO deck to align quality and operations?
Publish a joint KPI: release-to-tender cycle time with a named owner. Include OTIF by product class, temperature excursions, CAPA closeout time, and capacity utilization. Add DSCSA exception rate and average lane risk score. Keep the list tight and linked to enforcement.
How do we communicate capability without sounding promotional?
Lead with structure and risk, not adjectives. Use Atlanta-specific thresholds, owners, and SOP snapshots. Borrow the investor-communication playbook: clarity, restraint, and education about how decisions protect patients and margin. Precision convinces; hype invites scrutiny.
Red flags when you’re selecting a 3PL (ATL lens)
- Serialization theater: demos of EPCIS events without proving inbound/outbound reconciliation, exception closure, and partner interoperability at scale.
- GDP-lite: a “policy binder” but thin evidence of room-by-room temperature mapping, seasonal requalification, and excursion CAPA effectiveness.
- Power fragility: no dual feeds, undersized generators, or untested switchover, unacceptable in summer heat or storm season on the I-285 belt.
- Airport adjacency without airside reality: claiming pharma air capability at ATL but no CEIV Pharma alignment, no active cool-chain SLAs with integrators, and no dry-ice replenishment SOPs.
- Opaque WMS: can’t show 21 CFR Part 11 controls, role-based permissions, audit trails, and item/lot/serial integrity across RF and API workflows.
- Accessorial fog: bundled “pharma premium” with vague adders for gel packs, data loggers, late-night cutoffs, and special handling.
- DSCSA bolt-on: reliance on manual portals rather than event-driven APIs; no test evidence for returns VRS or suspect product quarantine and investigation.
- Carrier monoculture: one-parcel or one-LTL dependency despite ATL’s carrier diversity, limiting contingency options in Q4 parcel crunch.
- Validation on paper only: no IQ/OQ/PQ artifacts tied to your SKUs, lanes, and label sets; no change control cadence tied to release risk.
- Thin exception muscle: can’t produce a last-quarter exception ledger with timestamps, root causes, dispositions, and learnings.
The diligence packet CEOs should bring to the table
Standardize how Atlanta pharma CEOs present facility network inputs so 3PLs quote accurately and you de-risk implementation.
- Network fact sheet: facility list (ATL metro, Savannah gateway, regional satellites), temperature classes, capacities, redundancy tiers.
- Lane matrix: origin/destination, weekly volumes, temperature class, service levels, release timing, and parcel vs. LTL split.
- SKU risk profile: by storage class, stability budget, special handling, and pack-out recipe (including ship-from climate bands for ATL summer and winter).
- Quality core: GDP certification scope, change-control log (last 12 months), top 10 deviations with CAPA status, training matrix.
- DSCSA stack: EPCIS version, VRS provider, ATP checks, partner GLNs, and test endpoints for event exchange.
- Tech spec: WMS version, integration patterns (EDI/API), label formats, scanning symbologies, and portal access roles.
- Control model: RACI for release and holds, QBR deck template, KPI dictionary, and escalation ladder.
- Seasonality map: clinical launches, vaccine waves, allergy and respiratory spikes, payer cycle impacts, and Q4 parcel risks.
Operating model and control the 3PL should accept
- Cadence: weekly tier-2 ops huddle, monthly KPI and quality review, quarterly executive QBR with roadmap and risk forecast.
- KPIs that matter: release-to-ship lead time by lot, EPCIS post and acknowledgment success rate, excursion rate per 10k order lines, cycle-count accuracy by class, on-time dispatch by cutoff window.
- Signal thresholds: pre-agreed alerting for queue depth, pack-out workstation utilization, generator runtime, and trailer dwell at ATL cross-docks.
- Exception SLA: clock starts at event detection, documented interim controls, and closure with CAPA evidence and preventive actions.
- Change control: joint CAB, risk-based validation (IQ/OQ/PQ where required), and blackouts around clinical or launch dates.
The one-slide storyboard that wins the room
When you brief a 3PL or your board, compress the narrative without losing risk clarity.
- Top-left: current ATL-centered network map with redundancy tiers and release clocks.
- Top-right: three most material risks (power and heat, DSCSA interoperability, parcel peak) with mitigations and owners.
- Bottom-left: volume and lane panel with service classes and stability budgets.
- Bottom-right: control cadence and cutover gates (data readiness, OQ/PQ exit, parallel run stability).
Cost model discipline (avoid the “all-in” mirage)
- Unbundle: storage by temp class, handling by complexity tier, kitting, pack-out materials, data logger usage, and after-hours cutoffs.
- Energy realism: separate refrigeration power surcharges; test what happens when ATL temps exceed 95°F for a week.
- Transport clarity: pull-through parcel and LTL discounts, fuel and DAS policies, ATL airport fees, and accessorials for late tender.
- Quality fees: change control, validation effort, investigation hours, rate card plus approval thresholds.
- Risk pricing: explicit SLAs with earnbacks or penalties tied to release clocks and EPCIS success, not vanity metrics.
Benchmarks: DIM mitigation and carton right-sizing cut parcel costs 10–18%; seasonal pack-out variants reduce excursion CAPAs 20–35%; typical ATL integrator cool-chain accessorials add $12–$35 per international AWB in summer; quarterly validation/change-control budgets land at $5k–$25k depending on scope.
Implementation timeline grounded in ATL realities
- Data readiness (Weeks 0–4): item masters, pack-out BOMs, partner GLNs, label sets, EPCIS endpoints; resolve duplicates.
- Validation (Weeks 3–8): risk-based IQ/OQ on WMS and integrations; PQ with your top lanes and temperature classes.
- Cold-chain commissioning (Weeks 4–7): room mapping, seasonal buffers, generator tests, SOP drills for excursions.
- Carrier onboarding (Weeks 5–8): ATL hub cutoffs, alternate depots, thermal-protection SOPs, Q4 peak scenario practice.
- Parallel run (Weeks 7–10): shadow picks and ships with live EPCIS; exit only after stability metrics clear agreed bands.
Reality check: mid-market teams report 8–14 weeks total to stable-state with 1–3 weeks of improved exceptions; plan 10–15% labor buffer during parallel run.
What to avoid when selecting a 3PL
- Network theater: glossy maps without quantified capacity, redundancy tiers, and failure modes.
- Single-node overexposure: one mega-site in ATL with no Savannah or upstate relief for weather, power, or labor shocks.
- Portal lock-in: proprietary tools that block API access to DSCSA, inventory, and exceptions.
- Ambiguous SOWs: verbs like “support” and “assist” instead of measurable outputs for release, EPCIS, and excursions.
- Static pack-outs: no ATL-seasonal pack-out variants or data-driven pack-out selection.
- Validation afterthought: “we’ll validate later” in go-live plans. That defers risk to your patients and audits.
- Thin ATL bench: no trained backup supervisors, pharmacists (if needed), or maintenance techs for cold equipment.
- No scenario drills: lack of tabletop exercises for power loss, carrier failure, or serialization outage.
- Excursion amnesia: can’t produce the last three temperature deviation root causes with demonstrated learning.
- Price without proof: low rates with no time-and-motion basis and no accessorial schedule.
A simple scoring matrix you can send before the pitch
- Regulatory and quality (25%): GDP scope, validation evidence, CAPA outcomes, audit readiness.
- DSCSA and data (20%): EPCIS 1.2 support, VRS, ATP checks, API maturity, monitoring.
- Cold-chain resilience (15%): mapping, redundancy, generator runtime, excursion management.
- Service performance (15%): release-to-ship, on-time dispatch by cutoff, exception SLA adherence.
- Cost transparency (15%): unbundled rates, accessorial clarity, change-control pricing.
- ATL fit (10%): cutoffs, carrier mix, airport interface, regional contingency nodes.
Send the weights and evidence asks ahead of time to shape how Atlanta pharma CEOs present facility network details. Your vendors will prepare better, and you’ll compare apples to apples.
| Criteria | Weight | Scoring guidance (1–5) | Evidence required |
|---|---|---|---|
| Regulatory & Quality | 25% | 1=no IQ/OQ/PQ; 5=full, SKU/lane-specific PQ with CAPA closeouts & SOPs | Validation matrix, last 10 deviations/CAPAs, room mapping reports |
| DSCSA & Data | 20% | 1=manual portals; 5=EPCIS 1.2, VRS live, 99.5% uptime, 15–30 min ACK | API specs, uptime logs, event samples with retries |
| Cold-chain Resilience | 15% | 1=no generator test; 5=dual-feed, 400–600 kW gen, quarterly drills | Generator test logs, excursion ledger, handler SLAs |
| Service Performance | 15% | 1=no release KPI; 5=R2T 120–180 min, dispatch ≥96–98% | Last 90-day KPI trend, exception SLA reports |
| Cost Transparency | 15% | 1=all-in; 5=unbundled with accessorial schedule & FSC index | Rate card, accessorial table, example invoice |
| ATL Fit | 10% | 1=generic; 5=handler-named, cutoff-synced, storm playbooks | Named handlers, cutoffs, weather SOPs |
Complexity threshold model (who should run what, and when)
- If annual logistics spend < $500k and ≤3 temp classes, ≤2k orders/month → Atlanta-focused regional 3PL with shared-user cold capacity.
- If spend $500k–$2M, 3–5 temp classes, 2k–10k orders/month, DSCSA live → regional 3PL with dedicated zones; optional secondary node for seasonality.
- If spend > $2M or >10k orders/month, high SKU complexity, global lanes → national 3PL with pharma program + ATL node, dual nodes, and handler contracts.
- If clinical/launch volatility > 30% volume swing in 30 days → pre-approve surge SOW and retainer blocks (5–10% of monthly run rate).
Risk decision tree (if-then logic you can operationalize)
- If 2:00–6:00 p.m. ATL thunderstorm probability > 60% (NWS) and shipment includes 2–8°C with hold time < 24 hours → switch to pre-chilled ULD + pre-book handler cool room; if not available, move pickup to next AM courier with premium pack-out.
- If release-to-tender variance > 60 minutes for 3 days running → trigger joint RCA within 48 hours; 3PL expedites at cost if variance is on 3PL; shipper funds premium packaging if variance is on QA.
- If EPCIS event failure > 0.2% over 24 hours → freeze affected SKUs, route to exception queue P1, resume shipping only after reconciliation proof and test events pass for 50 consecutive orders.
Cost comparison template (fill this before the pitch)
| Line item | Benchmark range | Provider quote | Variance | Notes/assumptions |
|---|---|---|---|---|
| Pick/pack per order line | $1.00–$2.25 | Cold adders broken out? | ||
| Storage per pallet/day (2–8°C) | $2.50–$6.00 | Cycle count included? | ||
| Courier per stop (ATL, 2–8°C) | $80–$150 | After-hours fee? | ||
| Re-icing per carton | $25–$60 | Handler pass-through or markup? | ||
| Management fee | 3–7% of transport or $0.50–$1.50/order | Credits/earnbacks defined? | ||
| Implementation one-time | $25k–$75k | Validation scope included? | ||
| Service credit bands | 2–8% monthly fees | Automatic vs discretionary | ||
| Fuel surcharge basis | DOE-indexed 25–40% | Index and base date clear? |
Operating model comparison (what you actually buy)
| Model | Typical cost profile | Core SLAs | Strengths | Risks/Downsides | Best fit |
|---|---|---|---|---|---|
| In-house ATL DC | Fixed labor + utilities; capex $1–$3M for cold equip; opex $35–$55/pallet-month blended | Customized; R2T 120–180 min if staffed | Control, custom QA, fast change control | Capex risk; talent retention; disaster recovery cost | Stable volumes, strong QA/IT bench |
| Regional ATL 3PL (pharma-capable) | Management fee 3–7%; storage/handling per unit; courier $80–$150/stop 2–8°C | Dispatch ≥96–98%; EPCIS ACK 15–30 min; data uptime 99.5% | Local know-how, handler ties, agility | Capacity ceilings; Q4 courier scarcity | Mid-market spend $0.5–$2M; ATL-centric lanes |
| National 3PL (pharma program) | Higher base rates 3–8%; broader accessorial catalog; strong integrator buy | Global SOPs; multi-node redundancy; strong audit posture | Scale, multi-node resilience, bench depth | Change-order friction; less ATL-specific nuance day 1 | High complexity, multi-region growth, >$2M spend |
Use-case suitability matrix: courier vs parcel vs LTL (ATL lens)
| Mode | When to use | Cost benchmark | SLA reality | Key risks |
|---|---|---|---|---|
| Courier (metro) | Hospitals/IDNs within 50 miles; time/window sensitive | $45–$85 ambient; $80–$150 2–8°C; +$35–$85 after-hours | 4–8 hours release-to-delivery | Driver scarcity Q4; wait fees after 10–15 min |
| Parcel | Small packs, validated pack-outs, broad ZIP reach | Base + DAS $2–$8; DIM charges 6–12% uplift if mispacked | Next-day 10:30 a.m. 95–98% if met cutoffs | Peak surcharges; thermal exposure last mile |
| LTL | Bulk replenishment, 2–8°C with validated reefers | Linehaul + 25–40% FSC; appointment $5–$15 | 1–3 days regional with appointments | Dwell at terminals; reefer SOP variance |
Ten proof-point questions to ask in the room
- Show EPCIS event logs for a full week, including retries and partner acknowledgments. What was the fail rate and fix time?
- Open your change log. What changes touched WMS picking or labeling in the last 90 days and how were they validated?
- Walk through your last three temperature excursions: root cause, corrective, and preventive actions.
- Start the generator now. What’s the measured switchover time and protected load duration?
- Pull a random audit trail for a controlled item. Who touched it, when, and with what authority?
- Trace a return with VRS, from receipt to disposition and EPCIS update.
- Simulate a missed ATL parcel cutoff. What are your alternate tender points and how do you notify us?
- Show staffing rosters for peak weeks. Who is cross-trained for release, pack-out, and exception management?
- Demonstrate role setup for our external auditors. Least-privilege access and temporary credentials.
- Produce last quarter’s QBR deck. Were trends called early, and what changed as a result?
Make the presentation easy to evaluate
Package your narrative the same way every time: one-page network summary, data appendix (lanes, SKUs, volumes), risk register with mitigations and owners, and a control sheet with KPIs and cadences. That is how Atlanta pharma CEOs present facility network information that accelerates diligence, clarifies risk, and avoids surprises in implementation.